My scope and I: Pulse-width modulation
I’m taking a look at AVR’s PWM output with my new Rigol DS1052E oscilloscope.
I’m still new to this whole electrical engineering angle, but one thing I realized pretty quickly is that my trusty old multimeter won’t get me very far when I’m not dealing with stationary voltages.
I realized that, of course, when I was trying to debug a little circuit of mine that failed in a most peculiar way by going from one valid state to another seemingly without reason. I really could’ve used some insight into what, exactly, was happening in the few milliseconds just before the circuit decided to not do what I wanted it to.
A bit of research led me to the Rigol DS1052E digital oscilloscope. It’s probably not the only affordable scope on the market, but lots of people seem to think it’s some really cool equipment for entry-level hobbyists who want to get their feet wet with that kind of device.
So I put it on my birthday wishlist, and lo!, my wish was granted. Yay me! :-D
A new cool piece of measuring equipment needs something to measure. And I need to get acquainted with all those knobs and buttons. The User’s Guide is a good and worthy read, but nothing can replace just fiddling around with everything by myself to get a feel for it.
So, who’s up for being measured? My Arduino, of course.
One of the simplest non-trivial outputs an AVR can generate is a PWM (pulse-width modulated) voltage.
The idea is that, in absence of an actual DAC (digital-analog converter) that can actually generate arbitrary voltages in a given range, you can get almost identical results by just switching the power on and off very quickly, over and over again. PWM does exactly that. By default, with an Arduino, “very quickly” means about 500 times per second. The relative amount of “on” during each such cycle is called the “duty cycle”.
Let me just whip out my breadboard and stick an LED into it. On second thought, let’s also add a binary code switch to change the PWM duty cycle on the fly. Like this:
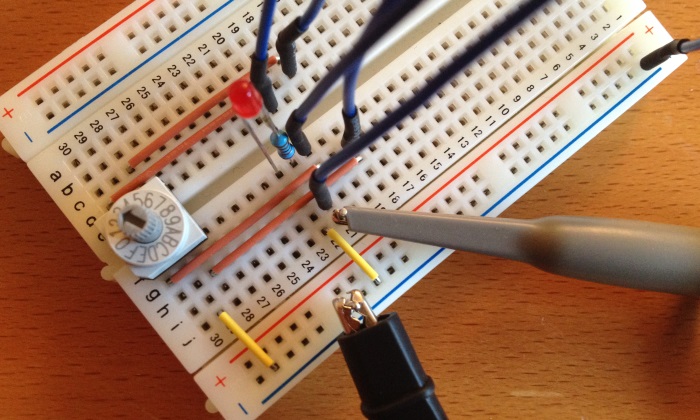
Note the oscilloscope probe’s gray hook tip near the LED’s anode and the black alligator clip connected to the ground rail.
Here’s the Arduino code to go with it:
void setup()
{
  pinMode( 3, OUTPUT);

  pinMode( 8, INPUT_PULLUP);
  pinMode( 9, INPUT_PULLUP);
  pinMode(10, INPUT_PULLUP);
  pinMode(11, INPUT_PULLUP);
}

uint8_t positionPrev = 255;

void loop()
{
  uint8_t position =
      (digitalRead( 8) == LOW ? 1 : 0)
    + (digitalRead( 9) == LOW ? 2 : 0)
    + (digitalRead(10) == LOW ? 4 : 0)
    + (digitalRead(11) == LOW ? 8 : 0);

  if (position != positionPrev) {
    analogWrite(3, position * (255 / 15));
    positionPrev = position;
  }
}
Depending on the position of the code switch (attached to pins 8–11), the PWM output on pin 3 is set to a value from 0 to 255. Each step on the code switch corresponds to 1/15 of the maximum value – for example, setting the switch to position 6 should result in a 40% duty cycle.
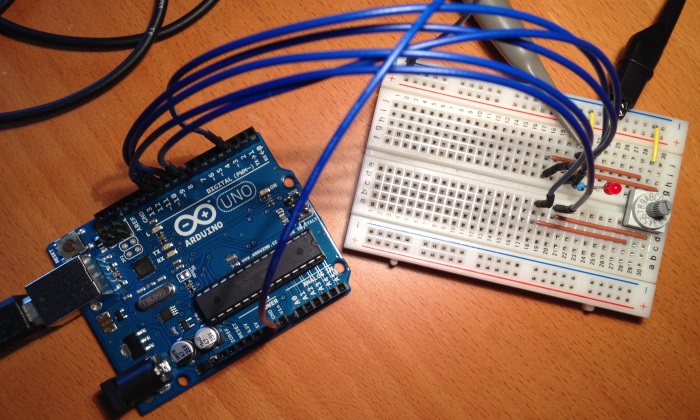
An overview of the entire setup, including the Arduino board (the USB cable is just for power supply):
The DS1052E oscilloscope briefly shows a splash screen while it boots (everything needs to boot these days!), and then I’m already in the middle of measuring… well, nothing much yet, really. I first have to tweak the time (horizontal), voltage (vertical) and trigger settings to actually get a stable signal.
There’s a handy button labeled AUTO in the upper-right corner, though.
Pressing it makes some internal relay click audibly once or twice, and only one or two seconds later, I’ve got a stable display.
The waveform is initially centered vertically, but pushing the VERTICAL POSITION knob resets ground level voltage to the middle of the screen.
(The yellow 1 arrow to the left indicates ground level.)
So this is what I’m seeing now:
The yellow 2.00V label in the lower-left corner tells me that the distance between one horizontal grid line to the next stands for 2 volts.
The top of the square wave is about two and a half grid lines above the bottom – that makes it approximately 5 volts.
Sounds about right!
Also at the bottom, the white Time 1.000ms label says that the time difference between vertical grid lines is one millisecond.
From the middle of the screen, just below the orange T pointer (which indicates the trigger point),
to the next similar wave to the right there is a horizontal distance of two grid lines – no, wait, a tiny bit more than two grid lines,
so the period of this signal is just above 2 ms, corresponding to a frequency of just below 500 Hz.
A really cool thing is that the DS1052E provides a whole bunch of automated measurements regarding the displayed waveform. By pressing the Measure button, then the Display All soft button, they’re displayed all in a block at the bottom of the screen.
Watch me change the switch from position 6 to 9 and then back again:
Note the frequency displayed in the upper-right corner: That’s the so-called frequency counter, which can be enabled by pressing the Utility button, then the Counter soft button.
Surprisingly, the frequency counter in the upper-right corner doesn’t show the same value
as the Freq measurement at the bottom of the measurements block.
And yet, both are reasonably stable.
How can that be?
My guess: The measured time values are aliased to a granularity of, I think, 20 microseconds at this resolution. The actual frequency is accurately displayed by the frequency counter in the upper-right corner. 489.87 Hz correspond to a period of 2.041 ms, but the measured value snaps to the next full 20 μs, that is, to 2.040 ms (talk about showing only significant figures!), whose inverse, in turn, is 490.2 Hz – the exact value displayed in the measurements box.
So the displayed measurements are to be taken with a grain of salt – especially where their displayed precision is concerned. Still useful, though, and certainly more accurate (and quicker) than doing the same by hand.
Something else catches my eye:
Vpp, the voltage “from peak to peak”, is consistently greater than the 5 volts an Arduino should be able to output.
And Vmin, the minimum voltage, is actually below ground.
What gives?
Let’s have a look at the rising edge of the square wave. The AUTO button shows a menu that provides a convenient shortcut to that, too. All I have to do is press the corresponding soft button and then tweak the horizontal scale a bit, and this is what I get:
So the voltage indeed does go significantly higher than 5 V! (One vertical division corresponds to 1 V.)
The voltage doesn’t really turn that hard corner you’d expect from an ideal square wave. Instead, it overshoots its target voltage, then oscillates back and forth with progressively smaller amplitude until it more or less hits the point.
For good measure (forgive the pun), here’s the falling edge, too:
Next time I’ll have a look at how that piezo sensor responds to being tapped on, and how I can reign it in to play nice with a comparator IC.